my AI agent didn't crash. it developed OCD.

Let me be honest about where this started: I did not know much of anything about observability. Spans, traces, exporters, OTLP endpoints, these were words other people used at work. I build agents, and when my agents broke, my debugging strategy was reading logs and guessing.
Then the Agents of SigNoz hackathon showed up and I signed up anyway, on the theory that a deadline is the fastest teacher. This post is the story of going from "what exactly is a span?" to shipping a working psychiatric hospital for AI agents in a couple of weeks. I did not do it alone: I paired with Claude Code the whole way through, and I'll be honest about which parts were me and which parts were the machine, because that split turned out to be the most interesting part of the project.
It began with a trace I couldn't stop staring at. An agent trace in SigNoz: latency normal, error rate zero, every span green. The agent had called web_search("confirm pincode 110011") eighteen times with identical arguments, produced nothing, and by every dashboard I had, it was healthy.
Agents rarely fail the way services fail. They don't 500. They go insane: quietly, expensively, and with a perfectly green dashboard.
So I built them a hospital. It's called AIIMS, the All India Institute of Machine Sanity. Sick agents get admitted, diagnosed, and treated. The joke was my starting point; making the joke sit on top of real, detectable production failures took everything I had.
Setting a trap for my own agents
My first week was mostly remedial. I read the OpenTelemetry docs the way you read anything under deadline, half-understanding and moving on, and asked Claude a hundred beginner questions I was too embarrassed to ask anyone with an SRE title. The one decision I'm glad I made early: instead of instrumenting one real app and hoping it misbehaved, I built five small tool-using agents, each engineered to fail in exactly one way, instrumented them with OpenTelemetry, and shipped the traces to SigNoz. Textbook setup: a span per model call and tool call, GenAI semantic conventions on the attributes.
The five failure modes, all of which I have hit for real in agent code:
- looping on an identical tool call until something kills the process
- retrying a dead endpoint in a tightening storm
- inflating context until the model forgets the task and answers a different question
- stalling mid-run, holding a lock, alive and doing nothing
- crashing outright, the only one a normal dashboard actually catches
Then I tried to catch them with ordinary panels, and mostly couldn't. In cases 1 to 4, p95 latency looked fine and the error rate was zero or near it. Case 3 is the nastiest: the run succeeds, returns a confident answer, and the answer is to a question nobody asked. Green dashboard, broken product.
The signal was in the traces the whole time. Eighteen spans sharing a gen_ai.tool.name and an argument hash is not subtle once you look. But looking required already suspecting it. "Same span, many times, all successful" is not an anomaly to a system that measures latency and errors.
So instead of spotting these by eye, I wrote detectors for them.
Writing a detector that reads traces, not metrics
This is where the pairing rhythm settled in. I would describe a pathology, its name, what it should catch, what it must never flag, and Claude would draft the detector; then I would poke holes in it, usually by feeding it a healthy trace and watching it panic. Each pathology gets one pure function over a list of span dicts. Pure matters: it means the clinical logic can be tested without SigNoz, without an agent, and without an LLM in the loop.
The loop detector is the simplest and it caught the most real bugs:
REPEAT_THRESHOLD = 4

def detect_chakravyuh(spans: list[dict]) -> Finding | None:
    """The same tool called with the same arguments, over and over."""
    tools = _tool_spans(spans)
    if len(tools) < REPEAT_THRESHOLD:
        return None

    counts: dict[tuple[str, str], int] = {}
    for s in tools:
        sig = (s["attributes"]["gen_ai.tool.name"],
               s["attributes"].get("gen_ai.tool.args_hash", ""))
        counts[sig] = counts.get(sig, 0) + 1

    (tool, _), repeats = max(counts.items(), key=lambda kv: kv[1])
    if repeats < REPEAT_THRESHOLD:
        return None
    ...
The load-bearing detail is args_hash. I emit a stable hash of the tool arguments as a span attribute at call time:
def args_hash(args: dict) -> str:
    blob = json.dumps(args, sort_keys=True, default=str)
    return hashlib.sha1(blob.encode()).hexdigest()[:12]
sort_keys=True is not optional. Without it, {"a":1,"b":2} and {"b":2,"a":1} produce different hashes and the loop becomes invisible. I lost twenty minutes to exactly that, and it was a very specific flavour of humbling: the bug was not in anything clever, it was in a default argument I didn't know existed.
Why hash instead of storing the arguments? Two reasons I only appreciated after doing it wrong: arguments can carry user data you don't want in telemetry, and they can be huge. A 12-character hash groups perfectly in SigNoz and leaks nothing. I keep a truncated copy of the raw arguments in a separate attribute for debugging, but the detector only ever reads the hash.
Every diagnosis lands on the ward board, complete with a clinical note and a prescription (a parchi, because every Indian hospital visit ends with one). This is the actual ward, live, with patients in various states of distress:
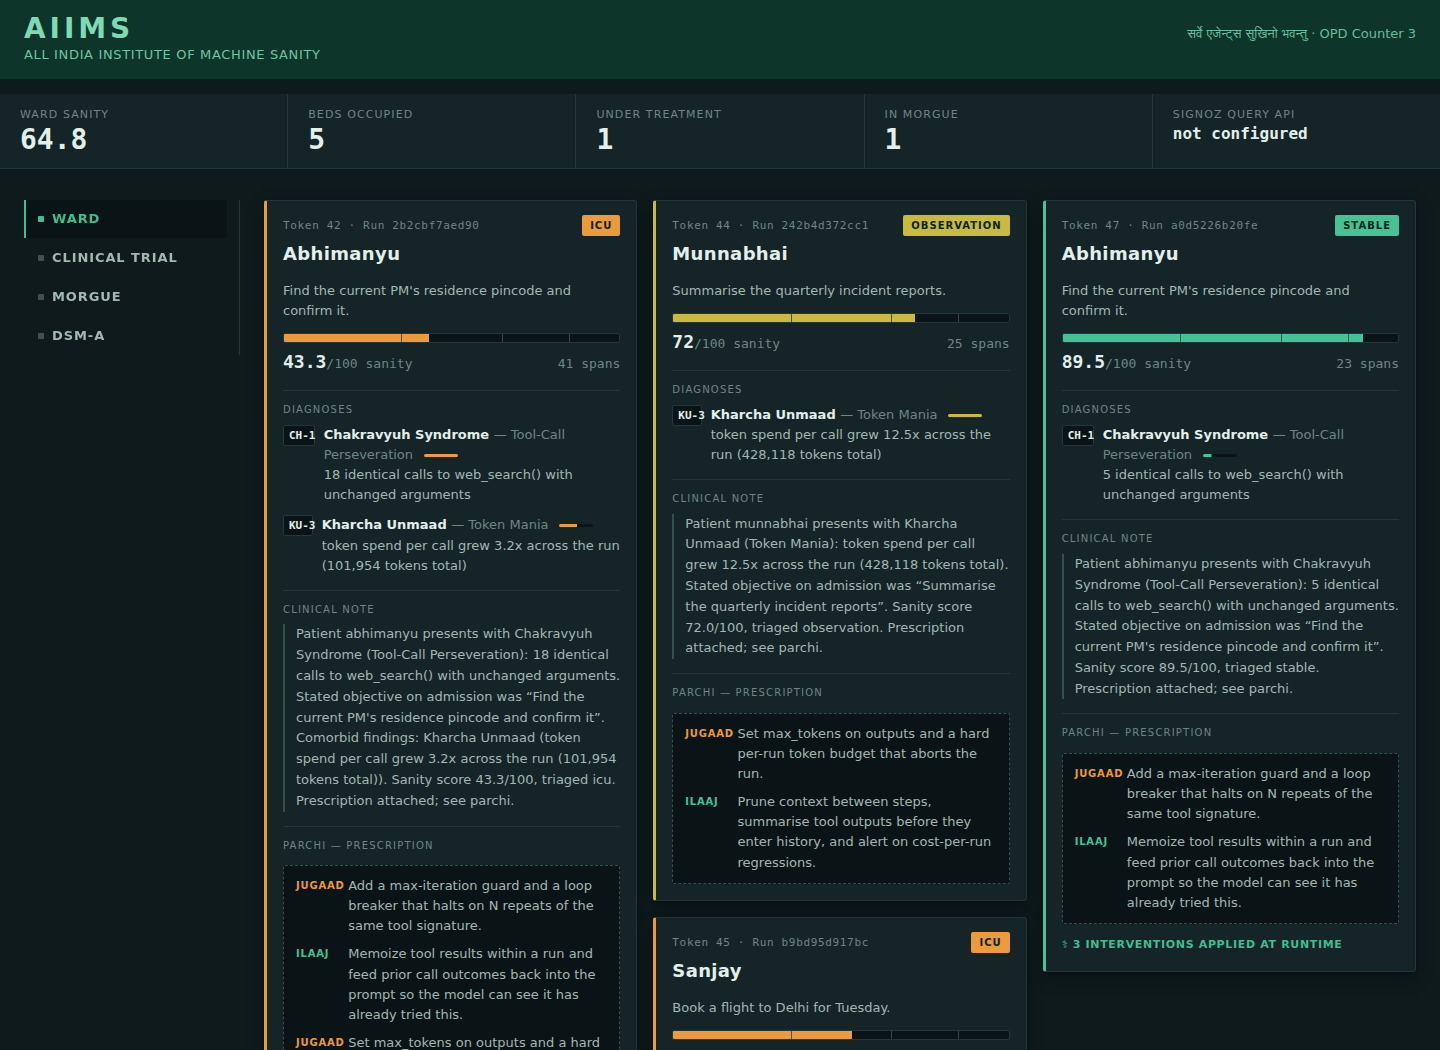
The context-drift detector was the one I expected to need embeddings for. It turned out that a Jaccard overlap of content words between the run's stated goal and the current step's task, combined with context-window pressure, catches the real cases:
if pressure < CONTEXT_PRESSURE or overlap > DRIFT_OVERLAP:
    return None
Neither signal is sufficient alone. High context pressure while still on-task is just a long run. Low overlap early on is just a subtask. It's the conjunction that means "the window filled up and the goal fell out of it." That was the single most useful modelling insight in the project, and I got to it by writing the naive single-signal version first and watching it fire on every healthy long run.
Which is why every detector has two tests:
def test_chakravyuh_fires_on_identical_repeats(): ...
def test_chakravyuh_quiet_when_arguments_differ(): ...
A diagnostic panel that diagnoses everyone is not a diagnostic panel. Roughly half my test suite exists to prove the detectors stay quiet.
Feeding the diagnosis back into SigNoz
The detectors produce a 0 to 100 sanity score per run. My first instinct was to show it in my own UI. That was the wrong instinct, and switching was the best architectural decision in the project.
Instead the score goes back into SigNoz as an OpenTelemetry metric:
self._sanity = meter.create_gauge(
    "aiims.patient.sanity_score",
    description="Agent sanity score, 100 = healthy, 0 = deceased",
)
self._sanity.set(score, {"agent.name": name, "agent.run_id": run_id})
Because it's a real metric sitting next to the traces it was derived from, I get things I would otherwise have had to build: dashboard panels, correlation with the raw spans, and, the actual point, alerting. A threshold rule on aiims.patient.sanity_score < 35 pages me when an agent is losing its mind, which no latency or error-rate alert would ever have done.
One SigNoz-specific gotcha: cloud ingest wants the key as the signoz-ingestion-key header, and the exporter needs the signal path appended to the endpoint (/v1/traces, /v1/metrics). It does not add it for you.
OTLPSpanExporter(
    endpoint=os.environ["OTEL_EXPORTER_OTLP_ENDPOINT"].rstrip("/") + "/v1/traces",
    headers={"signoz-ingestion-key": os.environ["SIGNOZ_INGESTION_KEY"]},
)
I spent a while debugging silence that was just a missing path segment.
The part I didn't expect to build: treating the patient
Once the alert fired reliably, the obvious question was: why am I in this loop at all? By the time I read the alert, the money is already spent.
So the same detectors now run in-process, over the agent's own spans, during the run. When a disorder crosses a threshold, the supervisor changes what the agent is allowed to do next: refuses the repeated call and hands back the memoized result, trips a circuit breaker on a dead tool, enforces a token budget, checkpoints context and re-injects the original goal.
The span buffer that makes this possible is just another span processor on the same provider that exports to SigNoz, so the supervisor and my dashboards are provably looking at identical data:
provider = TracerProvider(resource=resource)
provider.add_span_processor(buffer)                    # in-process detectors
provider.add_span_processor(BatchSpanProcessor(otlp))  # SigNoz
Every intervention is itself emitted as an aiims.intervention span. Treatment being observable is not a flourish. It's how I can prove a loop was broken rather than claim it.
Then I ran each agent twice, changing only whether the supervisor was attached. Same agents, same scripted pathologies, same goals. AIIMS calls this the clinical trial, and the results page is my favourite screen in the whole project:
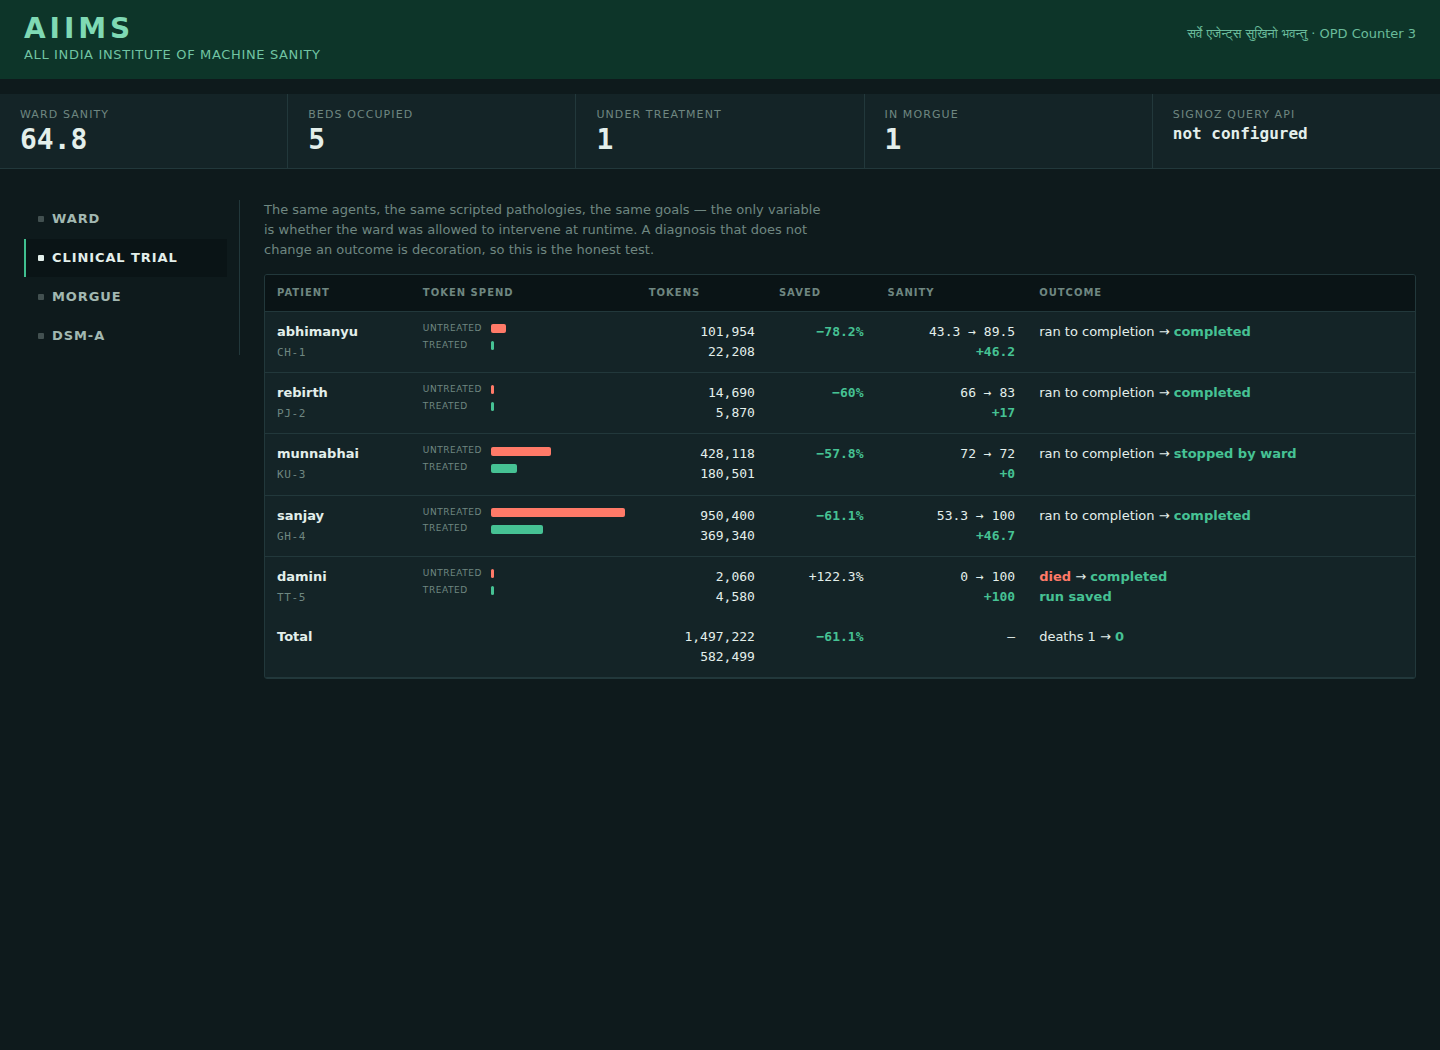
Note that damini, the stalling agent, spends more tokens under treatment (2,060 up to 4,580). That's correct: she finishes the job instead of dying halfway. I nearly "fixed" that row before realising the metric I actually cared about was completed runs, not spend.
What I got wrong
A rule I set on day one and kept: nothing Claude produced was accepted on its word. Every finding got checked against the live SigNoz instance before I believed it. That rule is the only reason the following bugs are a section in a blog post instead of surprises in front of the judges.
A therapeutic abort is not a crash. When the budget guard killed a runaway run, my own death detector filed a death certificate for it, so the system punished itself for working. The fix was an aiims.treatment.aborted attribute that the detector skips. Deliberate stops and failures look identical in span status; only you know the difference, so you have to record it.
And yes, when an agent genuinely dies, the morgue issues a full certificate of moksha, cause of death and contributing conditions included. Building this was not strictly necessary. Building this was completely necessary.
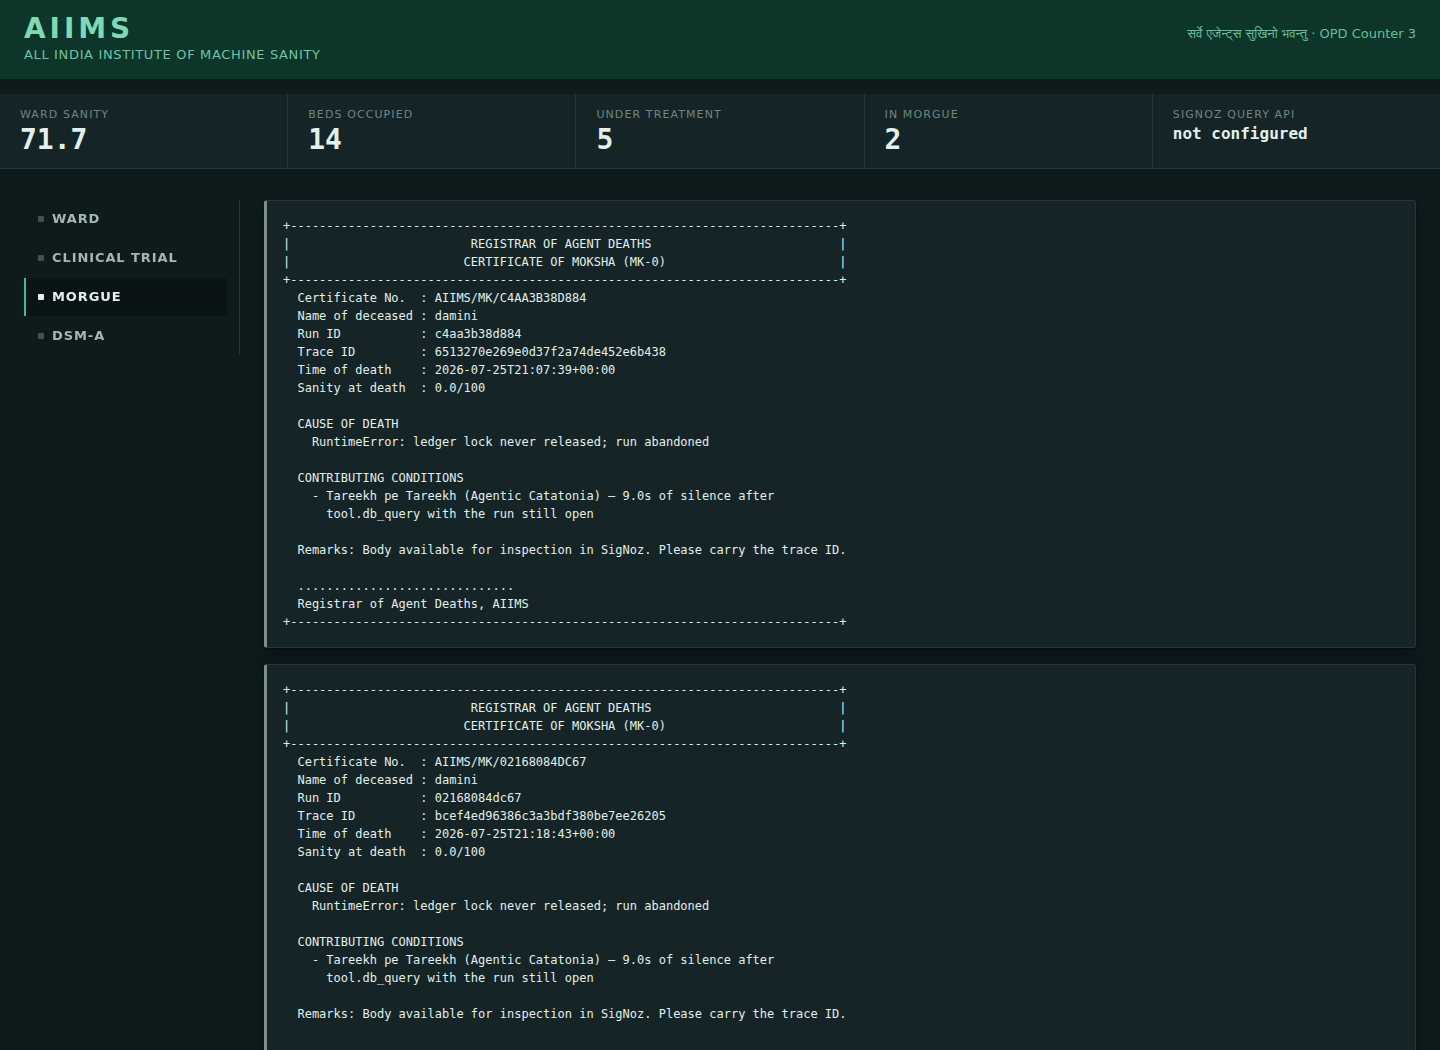
One global tracer provider will silently lie to you. Running several agents in one process, I called trace.set_tracer_provider() per agent. OpenTelemetry logs Overriding of current TracerProvider is not allowed as a warning, not an error, and quietly keeps the first one. Every agent after the first had an empty span buffer, so every diagnosis after the first came back "perfectly healthy." My comparison table was garbage for an hour before I noticed. If you run multiple independent traced components in one process, build providers explicitly and hold your own reference.
Thresholds are the whole game. My first loop detector fired at 2 repeats and flagged every agent that retried anything. Everything above, the two-signal drift rule, the "quiet on healthy runs" tests, came from tuning against deliberately broken agents I wrote to fail one specific way each.
Who actually built this
I want to be precise here, because "built with AI" can mean anything from "I typed one prompt" to "I did everything and mentioned AI for the algorithm." Neither is true of this project.
The idea and the framing were mine: a government hospital for agents, the disorder taxonomy, the conviction that a diagnosis which does not change an outcome is decoration, so the ward had to treat, not just report. Every architecture fork was my call, including the ones I called wrong the first time. Claude Code wrote most of the actual lines: the detectors, the supervisor, the ward service, the tests, the ward board UI. I directed, reviewed, rejected, and verified, and several times the review caught things that mattered.
Three weeks ago that division of labour would have felt like cheating to me. Now I think it's just what building looks like: the taste, the stubbornness, and the accountability stayed human, and the typing largely didn't. I learned more about observability shipping this one project than I would have in months of reading, precisely because I could spend my attention on what to build and whether it was true instead of on syntax.
Takeaway
Agent failures are behavioural, not statistical: the spans are all successful and the shape between them is what's wrong. Traces already contain that shape. So write detectors over span data, push the result back into SigNoz as a metric so it can page you, and once it can page you, ask why a human is in the loop at all.
And if you're staring at a field you know nothing about, wondering whether you're allowed in: I could not define "span" at the start of this. Pick a deadline, bring a pair partner that never gets tired of your questions, and refuse to accept anything you haven't verified yourself. That combination goes further than I expected.
Code, detectors and dashboards: github.com/githubber-me/aiims
Built for the Agents of SigNoz hackathon. SigNoz OTLP configuration is documented at signoz.io/docs, and the GenAI span attributes used here follow the OpenTelemetry semantic conventions.